Journal of Interpretation Research
Volume 21, Number 2
Evaluating Environmental Interpretation with Mixed Method: A Case Study at the International Crane Foundation, Wisconsin
Qing Ren
State University of New York
College of Environmental Science and Forestry
Currently at Rubenstein School of Environment and Natural Resources
University of Vermont
81 Carrigan Dr, Burlington, VT 05405, USA
tsing0619@gmail.com
315-447-7806
Elizabeth Folta
State University of New York
College of Environmental Science and Forestry
Abstract
A mixed method approach was used to evaluate effectiveness of environmental interpretation on visitors’ knowledge, environmental attitude, and pro-environmental behavioral intentions at the International Crane Foundation. Quantitative analysis suggests that participating in personal interpretation has the advantage of improving an audience’s knowledge level, but is no more effective than nonpersonal interpretation in influencing attitude and behavioral intentions. Personal and nonpersonal interpretive methods are both effective in promoting knowledge and behavioral intentions for conservation, but do not influence environmental attitude. Qualitative results indicate that participation in personal interpretation makes more of an impression in the visitors’ long-term memory than nonpersonal interpretation.
Keywords
environmental interpretation, conservation education, evaluation research, mixed method, International Crane Foundation
Problem Statement
Environmental interpretation, which connects audiences to natural resources, has often been considered an approach that not only provides experience and inspiration but also contributes to conservation and management of the resources (Knudson, Cable, & Beck, 2003; Munro, Morrison-Saunders, & Hughes, 2008; Powell & Ham, 2008; Weiler & Ham, 2010). The increasing demand for these practical objectives requires empirical research to evaluate the effectiveness of interpretive programs in order to optimize allocation of limited resources and maximize outcomes. However, the evaluation of environmental interpretation as a conservation strategy and management tool is difficult and insufficient. Short time spans, non-captive audiences, and various site-specific situations make the evaluation effort difficult. Some problems in interpretation research include lack of generic instrument and methodology (Munro et al., 2008; Weiler & Ham, 2010), lack of understanding of the longer-term effects (Orams, 1997), and lack of understanding of the differences between various types the programs.
In this study, we evaluated the environmental interpretive program at the headquarters of International Crane Foundation (ICF) near Baraboo, Wisconsin, where on-site interpretation is applied as a strategy in the overall environmental education effort of the organization. Our goal was to investigate the effectiveness of the environmental interpretation program with a method that combined quantitative and qualitative measurements. We aimed to explore evaluation tools as well as inform management of interpretation and educational strategy. Our quantitative hypotheses and qualitative research focus were:
- Visitors who participate in personal interpretation (Group PI) have significantly greater changes in knowledge, attitude, and behavioral intention than the completely self-guided visitors (Group SG, Research Question 1).
- The qualitative proportion of the study takes an inductive approach and explores the key factors in the visitors’ on-site experiences (Research Question 2).
Review of Literature
The roots of interpretive activities reach back to the early days of national parks, and it is now applied in various places (e.g.; museums, historical heritage sites, other recreational attractions). The sites that carry out environmental interpretation often expect to achieve conservation and management objectives by offering programs to a variety of audiences. These objectives may include mitigating the negative impacts on the natural environment (Kim et al., 2011), increasing supportive behaviors for conservation (Orams, 2004; Powell & Ham, 2008), and promoting visitors’ understanding of conservation and pro-environmental attitudes (Kohl, 2005; Zeppel & Muloin, 2008). In this framework, interpretation is utilized as a communication tool that serves practical conservation purposes in various scenarios.Orion and Hofsten (1994) reported that empirical research on the effectiveness of environmental interpretation has been growing substantially in recent decades (cited in Knapp & Yang, 2002;). Informing management and justifying the resource input have been mentioned frequently as the assumption and justification for the empirical evaluation of interpretive programs (Kim et al., 2011; Munro et al., 2008; Powell & Ham, 2008).
Observations of successful cases have been collected as examples of interpretation being used as an effective management tool (Knudson et al., 2003; Sharpe, 1976). Meanwhile, researchers have been seeking empirical evidence to support the conjectured effectiveness and identify gaps. Skibins, Powell, and Stern (2012) indicated that “While there is much anecdotal evidence to support the basic principles of interpretation, there is often a gap in empirical evidence for whether these principles influence visitor outcome…” (p. 26). The current principles and guidelines for interpretation are largely based on experience in practices and are mostly intuitive as opposed to rational. Therefore, the information provided by empirical research would be beneficial for those managers who have limited resources and want to use them wisely.
Researchers have also been attempting to adopt or construct theoretical frameworks for environmental interpretation. Istvan (1993) indicated that behaviorism provides the central dogma for the methodology and framework through which the transmission model maps the interpretive communication. The behaviorism-centered framework is consistent with the shared purpose of behavioral modification as a problem-solving approach that blends environmental interpretation and environmental education. In fact, studies in these two disciplines often adopt similar theories and methodologies as well (Knapp & Poff, 2001).
Theories of reasoned action (Fishbein, 1979) and planned behavior (Ajzen, 1991) are often applied as the basis for measuring changes in knowledge, attitude, and behavior in research of environmental interpretation and education; also, they provide a theoretical framework to draw connections between practices and desired outcomes. Yet, the connections and routes that lead to behavioral change are not thoroughly understood. Ham (2007, p. 42) indicated that “most research does not support the assumption that increasing visitors’ general factual knowledge about something will necessarily influence their attitudes in any particular direction” (Holbrook, Berent, Krosnick, Visser, & Boninger, 2005; Wiles & Hall, 2003).
One of the most commonly used means of classification for interpretation is to distinguish personal from nonpersonal interpretive media (Bacher et al., 2007; Ham, 1992; Knudson et al., 2003). Personal interpretation refers to interpretive programs that involve face-to-face communication between interpreters and visitors, such as guided tours and demonstrations (M. Jones & Georgen, 2012; Weiler & Ham, 2010). In contrast, nonpersonal interpretation tends to make use of “static” interpretation methods such as printed materials, exhibits, self-guided walks, and electronic media (Ham & Weiler, 2002; Ruchter, Klar, & Geiger, 2010). Personal interpretive programs are often considered to have greater intensity and influence than nonpersonal interpretive programs (Hughes & Morrison-Saunders, 2005). Interpersonal communication potentially has more influence on visitors through interaction between the interpreter and the participants and by addressing specific needs (Wearing & Neil, 2013) as well as allows for flexibility in terms of various visitor types and methods of communicating messages (Magill, 1995). This assumed advantage has been rarely verified by empirical studies, and the different outcomes of the two types of interpretive approaches are poorly understood. Most previous evaluative studies either only focused on one type of interpretation or assessed both methods separately (Forist, 2003; Munro et al., 2008; Weiler & Ham, 2010), and very few studies have evaluated the effectiveness of interpretation from the perspective of comparing the two types.
In a review of empirical studies on interpretation that was based on 70 articles, Skibins et al. (2012) indicated that 24% of the studies employed qualitative methods, but only 11% were solely qualitative. Although several authors noted that using qualitative methods itself provides valuable information in understanding the effectiveness of interpretive programs (Knapp & Poff, 2001; Stewart, Hayward, Devlin, & Kirby, 2003; Trotter, 2014), quantitative methods remain dominant in the research due to their duplicability and reliability. A mixed methodology approach is a useful to take advantage of both quantitative and qualitative methods.
Method
We used both quantitative and qualitative approaches to examine the outcomes of two different types of interpretation at ICF. We employed a quasi-experimental design to compare the outcomes of personal interpretation and self-guiding in influencing visitors’ knowledge, environmental attitude, and behavioral intentions about conservation. Both immediate and longer-term (three-month) changes were measured using repeated measurements approach, which is commonly applied in clinical and psychological research (Frison & Pocock, 1992; Dunlap, Cortina, Vaslow, & Burke, 2002). Qualitative analysis was conducted to identify key components in the visitors’ on-site experience.
 Study site
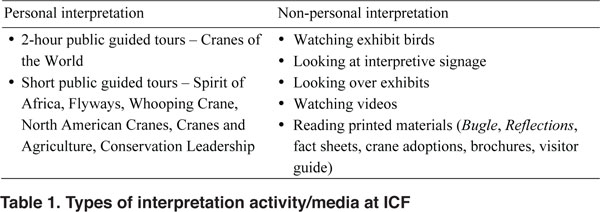
Founded in 1973, International Crane Foundation (ICF) is a conservation organization which maintains a 225-acre campus as its world headquarters. ICF’s mission is to work “worldwide to conserve cranes and their habitats, ecosystems, watersheds, and flyways on which they depend” (International Crane Foundation, 2014a). The public facilities include the captive crane exhibit, visitor center, theater, education center, gift shop, and four miles of trails. In 2011, the ICF campus was visited by over 25,000 people (International Crane Foundation, 2012). ICF provides various types of conservation education opportunities including public tours and various types of nonpersonal interpretive media (Table 1).
Instrument design
Three questionnaires were developed for the pre-, post-, and three-month follow-up surveys, measuring the same dependent variables: knowledge, attitude, and behavioral intentions. The knowledge module contained five true/false questions about cranes and their habitats. In the attitude section, we used a revised scale based on the New Ecological Paradigm scale (Dunlap, Van Liere, Mertig, & Jones, 2002) to evaluate the respondents’ pro-environmental attitude. The scale consisted of six items about the relationships between humans and wildlife/natural environment. For each item, the participants chose a point from the five-point Likert alternatives ranging from “strongly disagree” to “strongly agree.” Three of these items were worded in a “pro-environmental” way and the other three were worded in the opposite manner. Behavioral intentions were measured by a unidirectional five-point Likert scale that contained five items about willingness to support ICF and take actions to benefit the environment.
The pre-questionnaire contained a short demographic section, and the post-questionnaire had an additional section about allocation of time during the visit. At the end of the post-questionnaire, respondents were asked if they were willing to take a follow-up online survey three months later. The three-month follow-up questionnaire had two open-ended questions about the participant’s experience visiting ICF and the same basic modules as in the previous questionnaires.
Data collection
The on-site surveys took place from June 1 until August 20, 2013. A total of 33 survey days were randomly selected in the period with the proportion of two weekdays and one weekend day per week.
On each survey day, we carried out paper-and-pencil questionnaire surveys in the visitor center from 9 am to 4 pm. Each participant was requested to wear a badge that had a unique tracking number. Upon finishing the post-survey, the respondents who had agreed to participate in the three-month follow-up survey were asked to provide their email addresses on a separate sign-up sheet. We recorded the tracking number along with every email address to ensure that the three-month follow-up questionnaire could be matched with the corresponding previous questionnaires. The follow-up online survey took place from November 15, 2013, to January 31, 2014, using Survey Monkey.
Data analysis
Quantitative statistical analyses were performed in SAS 9.3 and SPSS 21. For the knowledge section, the respondents received one point for each correct answer or zero points for a wrong answer or skipped question. The points of all questions were added to generate the overall score (K) for each individual questionnaire.
We intended to measure attitude and behavioral intentions with multiple-item Likert scales. Factor analysis was performed prior to all of the following analyses in order to test the internal consistency of the scales. Because low internal consistency occurred for both attitude and behavioral intention scales, we did not use the whole set of items as a single factor, but analyzed each of the items as individual variables. Paired t-test was used to compare the changes within a group over time, and two-sample t-test was applied to compare the differences between the two groups of visitors.
For the Likert-type variables, we coded the responses of the five-point Likert items from 1 to 5 (Strongly disagree=1, Disagree=2, Unsure=3, Agree=4, and Strongly agree=5). The three reversely phrased items, 2, 3, and 5, were also reversely coded in order to make all items unidimensional.
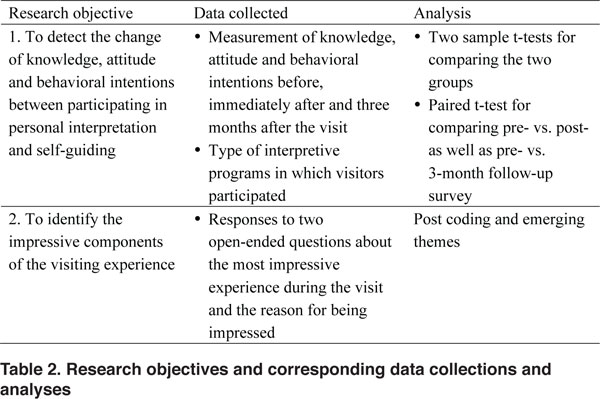
Table 2 summarizes the data collected and how we analyzed them for each research question (objective).
Results
Descriptive Statistics
We asked 451 visitors to participate in the research, and 404 agreed and completed (at least part of) both pre- and post-questionnaires. The response rate was 89.6% for the on-site surveys. Among these respondents, 375 (92.8%) completed the crucial components (activity type, knowledge, attitude, and behavioral intentions) on both questionnaires. And 105 (26.0%) participants signed up for the follow-up online survey. Out of these signed-up volunteers, 60 actually participated in the online survey and 55 completed it entirely. The response rate of the online survey was 57.1%.
A total of 393 participants reported their nationality, and 385 of them were from the United States. We also had 8 international participants from Canada (3), England (1), Switzerland (1), Denmark (1), Germany (1), and Japan (1). Little less than a half of the US visitors were from Wisconsin (178), and the other 207 were from 28 other states, leading by Illinois (69), Minnesota (26), Mississippi (13), Ohio (10), and Idaho (10). Only adults were recruited in the survey (all of the participants were above 18 years old).
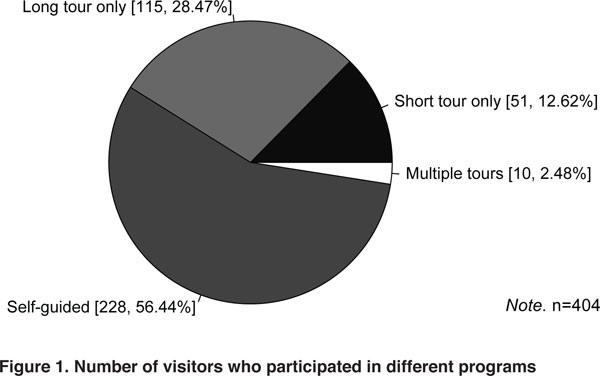
Among the 404 respondents, 176 (43.6%) participated in guided tours (Group PI) and 228 (56.4%) were self-guided (Group SG). For Group PI, 115 visitors participated in the Cranes of the World tour, which was offered twice a day, and 51 participated in the featured short tours (Spirit of Africa/Flyway) offered daily. In addition, 10 visitors participated in both the two-hour tour and the featured tours (Figure 1).
Internal consistency and factor analysis
Computation of Cronbach’s Alpha showed a low internal consistency between the items within each of the scales used for testing environmental attitude and behavioral intentions. Then we attempted to screen out individual inconsistent items using factor analysis. Four factors were kept in the analysis using principle component method, but none of the factor explains an adequate proportion to the total variance (>70%). Based on the contribution to factors, Cronbach’s Alpha was examined again for the items that have a loading larger than 0.5 on a single factor, with exception for the three-month follow-up survey on attitude, no Cronbach’s Alpha was found to be larger than 0.7 based on more than two variables. Therefore, each item was examined individually in the following analyses.
Research Question 1
Knowledge
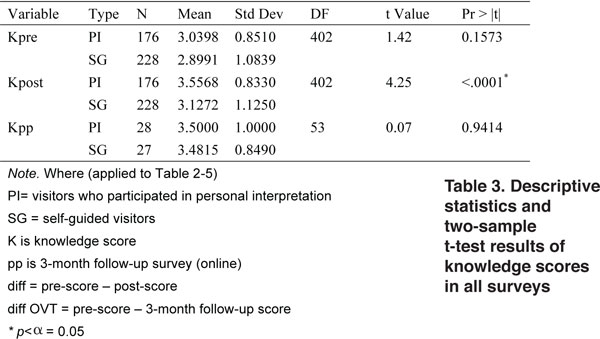
No significant difference in knowledge was detected between the two groups in the pre-survey (p=0.1573, α=0.05). After the visit, Group PI received significantly higher scores than Group SG (p<0.0001, α=0.05). However, the two groups were very close on the knowledge score in the three-month follow-up survey (p=0.9414, α=0.05) (Table 3).
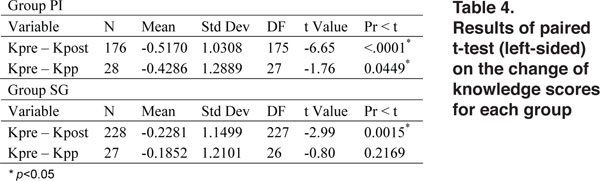
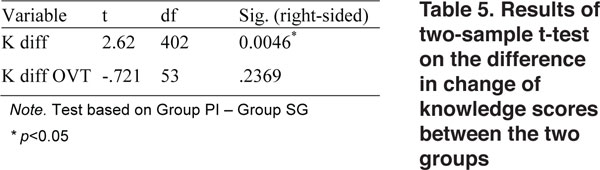
The paired t-test on the difference between pre- and post- knowledge scores for each group indicates significant improvement in the post-survey for both groups. Meanwhile, the comparison of pre- and 3-month follow-up scores shows that the visitors that participated in PI (Group PI) maintained this improvement after three months (p=0.0015, α=0.05), whereas the SG (Group SG) did not score differently from their own pre-survey (p=0.2169, α=0.05) (Table 4). The improvement from pre-survey to post-survey for Group PI was significantly greater than that of Group SG (p=0.0045, α=0.05); however, the improvement over the three-month period was not significantly different between the two groups (Table 5).
Attitude
The distributions of all items in the attitude module are left-skewed. When comparing the results of two-sampled t-test between the two groups, none of the items showed any significant difference. According to the results of paired t-test for each group, only item 2 had a significant difference change for both Group PI (p<0.001) and Group SG (p<0.001); however, the subsequent two-sample t-test found no significant difference in the degree of change on item 2 between groups (p=0.253).
Behavioral intentions
The two-sample t-test on the score differences showed that none of the individual item scores of behavioral intention was significantly different between the groups except for item 3 (I plan to visit ICF again this season) in pre- and post-surveys (p=0.013). The results of paired t-test on the differences in behavioral intention items between pre- and post- as well as pre- and three-month follow-up surveys indicate that significant differences existed in pair 1 (B1pre−B1post, p<0.001), pair 2 (B2pre−B2post, p<0.001), pair 3 (B3pre−B3post, p<0.001), and pair 8 (B3pre−B3pp, p<0.001) for both groups. Then the differences in these four pairs were compared between groups, but no significant difference was found in any of the items.
 Research Question 2
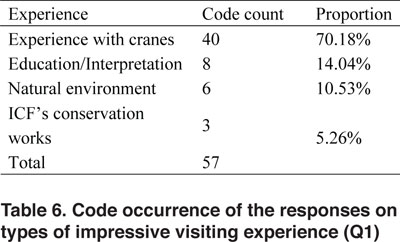
For the first question (the most impressive component of the visiting experience), four master codes were generated by categorizing the root codes of the first question (Table 6). The inter-rater reliability between the two coders was found to be Kappa = 0.816 (p <.0.001), 95% CI (0.629, 0.960).
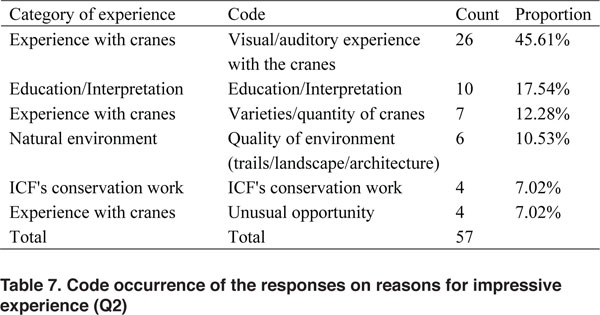
Coding of the second question (why the particular experience impressed the respondent) showed that the most common reason was a visual or auditory experience with the cranes (45.61%, Table 7).
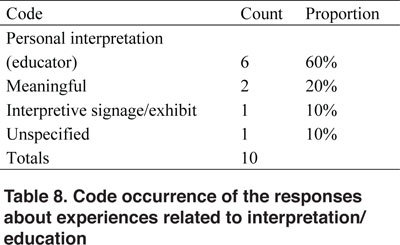
Further breaking down the responses under the code “education/interpretation” shows that personal interpretation plays a vital role in the visitors’ experience. Out of the 10 responses related to interpretive or educational experience, six mentioned that the educator or guided tour added most to their experience (Table 8).
Discussion
Compared to self-guided, personal interpretation participants improved their knowledge about cranes and ecosystems significantly more through the program and they were able to maintain the knowledge over a longer period time. However, the advantage in knowledge improvement obtained from personal interpretation reduced over time. Our hypotheses about the advantage of personal interpretation in knowledge delivery was supported.
Attitude change over the course of the program was similar between the two groups. When individual items were examined, both groups of visitors had a significantly higher concern after the visit in regard to “Humans can easily replace wetlands lost to development.” The personal interpretation participants also scored higher on item 5, “Too much damage has already been done to the environment for individuals to make a difference” in the three-month follow-up survey. All visitors became more positive about individuals making a difference to conserve the natural environment in the online survey. On the other hand, the scores of items 4 and 6 in the online survey were lower than their pre-scores. Self-guided visitors scored more conservatively on “Humans and other wildlife benefit from the protection of cranes” and “I am concerned about wetland loss and degradation” in the three-month follow-up survey. The results reveal the complex relationships between knowing the facts, changing attitude, and making conscious decisions to help the environment, and also show inconsistency with the current frameworks such as planned behavior.
The results do not support our hypothesis that the personal interpretation participants would have a more significant change in attitude than self-guided visitors; however, it merits attention that a shift toward the pro-conservative end in the three-month follow-up survey occurred on two of the items for SG. This tendency did not occur among visitors who participated in personal interpretation. The clearest assumption of the results is that both personal and nonpersonal interpretations have strong influences on visitors’ concerns about losing natural wetlands to development; however, the effectiveness does not differ between the types, and effects over a relatively long term require further examination. The assumed advantage of personal interpretation in current literature (Hughes & Morrison-Saunders, 2005) needs to be examined at more sites in order to justify the intensive resource inputs.
On individual items, the personal interpretation participants and self-guided visitors did not score much differently except for item 3 in the pre- and post-surveys. The personal interpretation participants actually had lower intention to visit ICF again that season in both pre- and post-surveys. They might have had a satisfied experience and not feel necessity to visit again. Also, it is possible that personal interpretation participants tend to have longer travel times and it is unrealistic for them to visit again in the same season.
In the behavioral module, the personal interpretation participants and self-guided visitors both scored significantly higher on item 1 (consider becoming a member of ICF), item 2 (tell others about ICF), and item 3 (visit ICF again this season) in the post-survey. The self-guided visitors also indicated that they became more positive about making a change at home to benefit the environment. In the three-month follow-up survey, both groups had higher intentions to visit ICF again compared to their pre-survey responses. The self-guided visitors also had a significant improve in their intentions to become members of ICF in the three-month follow-up survey.
The qualitative analyses indicate that the indubitable major factor was “experience with cranes,” and the most important experience for the visitors was simply viewing the cranes up close. Many visitors mentioned that they appreciate the diversity of cranes and the unique opportunity to see the varieties of cranes at ICF. The second most influential experience was participating in the interpretive program or educational experience. The most favorable experience under this category was taking the guided tours and listening to presentations, which indicate that personal interpretation played a highly significant role in the overall educational experience.
These findings reflect intricate results of interpretation activities. Some of the expected outcomes of interpretation identified by the literature, including improving participants’ awareness of conservation, promoting pro-environmental attitudes (Kohl, 2005; Zeppel & Muloin, 2008), and increasing supportive behaviors for conservation (Orams, 2004; Powell & Ham, 2008) were not completely affirmed in this study. The visitors’ responses showed some retention, largely on memorizing scientific facts, but changes in attitude and behavioral intentions were inconsistent and difficult to be endorsed, especially in a longer time period.
Meanwhile, the results show discrepancies between changes in knowledge and attitude/behavior, which would undermine the framework of behaviorism based on theories of reasoned action and planned behavior. This observation is consistent with several other studies (Holbrook, Berent, Krosnick, Visser, & Boninger, 2005; Wiles & Hall, 2003) summarized by Ham (2007). The three-month follow-up survey also reveals that the long-term influences of interpretation programs are precarious. If encouraging long-term behavioral changes is one of the core values of environmental interpretation, obviously we still have long way to go in order to understand how to make it happen. This also posts questions on the adoption of behaviorism-based survey indicators that showed popularity in the meta-analysis conducted by Munro et al. (2008). Introducing innovative measurement approaches from social psychology and behavioral research is a potential future direction.
Although personal interpretation participants did better in memorizing communicated facts, the presumed advantages of personal interpretation recognized by the literature (Hughes & Morrison-Saunders, 2005; Wearing & Neil; Magill) were not completely affirmed by outcomes on attitude and behavior intentions. More research is needed in order to inform and justify the prioritization of limited resources. In addition, the nonpersonal interpretation assessed in this study were mostly static while interactive interpretation with technologies are increasingly popular, and therefore understanding the potentials of these new methods and comparison between different approaches would also be valuable for the practices in environmental interpretation.
The results should be interpreted in a cautionary but not definitive manner due to the limitations of our methodology and potential sampling biases. Our attempt of using multiple items to assess an overarching latent variable (environmental attitude) was unsuccessful due to the lack of internal consistency, and this brought up the question if designing the variables individually would be a more legitimate approach. At least, conducting a preliminary survey with a decent sample size and testing the internal consistency of a set of items when possible would be beneficial to reveal the latent variable of interest more convincingly. Biases from on-site semi-convenient sampling introduce potential errors, and exploring cost-efficient sampling methods for interpretation research is desired.
Summary
Inclusion of guided tours produces an advantage in delivering information and influencing the visitors’ knowledge about conservation. This advantage is more substantial immediately after the visit, and evidently remains significant for a relatively long time. The two types of interpretation do not differ much in causing attitude changes and behavioral alterations in visitors. Neither of them changes the visitors’ environmental attitude much, but both of them improved some immediate behavioral intentions.
The visitors are mostly impressed by sensory experiences with the captive cranes, such as seeing cranes up close in the natural environment. It is reasonable to assume that changes in attitude and behavioral intentions for both visitor groups could be highly related to their direct exposure to the natural environment and associated emotional components.
References
Ajzen, I. (1991). The theory of planned behavior. Organizational Behavior and Human Decision Processes, 50(2), 179–211.
Bacher, K., Baltrus, A., Barrie, B., Cardea, D., Chandler, L., Dahlen, D., et al. (2007). Interpretive Development Program - professional standards for learning and performance. National Park Service, US Department of the Interior.
Bruin, J. 2006. newtest: command to compute new test. UCLA: Statistical Consulting Group. http://www.ats.ucla.edu/stat/stata/ado/analysis/.
Dunlap, R. E., Van Liere, K. D., Mertig, A. G., & Jones, R. E. (2002). Measuring endorsement of the new ecological paradigm: a revised NEP scale. Journal of Social Issues, 56(3), 425–442.
Dunlap, W. P., Cortina, J. M., Vaslow, J. B. & Burke, M. J. (1996). Meta-analysis of experiments with matched groups or repeated measures designs. Psychological Methods 1(2), 170–177.
Fishbein, M. (1979). A theory of reasoned action: Some applications and implications. Nebraska Symposium on Motivation, 27, 65–116.
Forist, B. E. (2003). Visitor Use and Evaluation of Interpretive Media. National Park Service, US Department of the Interior.
Frison, L. & Pocock, S. J. (1992). Repeated measures in clinical trials: Analysis using mean summary statistics and its implications for design. Statistics in Medicine 11(13), 1685–1704.
Ham, S. H. (1992). Environmental Interpretation. Golden, Colorado: North American Press.
Ham, S. H. (2007). Can interpretation really make a difference? Answers to four questions from cognitive and behavioral psychology (pp. 25–29). Presented at the Interpreting World Heritage Conference, Vancouver, Canada: National Association for Interpretation Fort Collins, CO.
Ham, S. H., & Weiler, B. (2002). Interpretation as the centerpiece of sustainable wildlife tourism. In R. Harris, T. Griffin, & P. Williams, Sustainable Tourism (2nd ed., pp. 35–44). Routledge.
Holbrook, A. L., Berent, M. K., Krosnick, J. A., Visser, P. S., & Boninger, D. S. (2005). Attitude importance and the accumulation of attitude-relevant knowledge in memory. Journal of Personality and Social Psychology, 88(5), 749–769.
Hughes, M., & Morrison-Saunders, A. (2005). Interpretation, activity participation, and environmental attitudes of visitors to Penguin Island, Western Australia. Society & Natural Resources, 18(7), 611–624.
International Crane Foundation. (2012). International Crane Foundation Naturalist Traning Manual (pp. 1–111).
International Crane Foundation. (2014a). About International Crane Foundation. Retrieved March 2014, from https://www.savingcranes.org/about-icf.html
Istvan, L. B. (1993). Communicating the Arcane: A Conceptual Framework for Environmental Interpretation. University of Washington.
Jones, M., & Georgen, C. (2012). Wyoming State Parks, Historic Sites & Trails Proposed Interpretive Services Guidelines. SPHST Interpretive Committee.
Kim, A. K. J., Airey, D., & Szivas, E. (2011). The multiple assessment of interpretation effectiveness: Promoting visitors’ environmental attitudes and behavior. Journal of Travel Research, 50(3), 321–334.
Knapp, D., & Poff, R. (2001). A qualitative analysis of the immediate and short-term impact of an environmental interpretive program. Environmental Education Research, 7(1), 55–65.
Knapp, D., & Yang, L.-L. (2002). A Phenomenological Analysis of Long-Term Recollections of an Interpretive Program. Journal of Interpretation Research, 7(2), 7–17.
Knudson, D. M., Cable, T. T., & Beck, L. (2003). Interpretation of Cultural and Natural Resources. Venture Pub.
Kohl, J. (2005). Putting environmental interpretation to work for conservation in a park setting: Conceptualizing principal conservation strategies. Applied Environmental Education & Communication, 4(1), 43–54.
Magill, A. W. (1995). Multicultural wildland users: a growing communication challenge. Environmental Professional, 17, 51–54.
Munro, J. K., Morrison-Saunders, A., & Hughes, M. (2008). Environmental interpretation evaluation in natural areas. Journal of Ecotourism, 7(1), 1–14. http://doi.org/10.2167/joe137.0
Orams, M. B. (1997). The effectiveness of environmental education: can we turn tourists into ‘Greenies’? Progress in Tourism and Hospitality Research, 3, 295–306.
Orams, M. B. (2004). Using interpretation to manage nature-based tourism. Journal of Sustainable Tourism, 4(2), 81–94.
Orion, N., & Hofstein, A. (1994). Factors that influence learning during a scientific field trip in a natural environment. Journal of Research in Science Teaching, 31(10), 1097–1119. http://doi.org/10.1002/tea.3660311005
Powell, R. B., & Ham, S. H. (2008). Can ecotourism interpretation really lead to pro-conservation knowledge, attitudes and behaviour? Evidence from the Galapagos Islands. Journal of Sustainable Tourism, 16(4), 467–489.
Ruchter, M., Klar, B., & Geiger, W. (2010). Comparing the effects of mobile computers and traditional approaches in environmental education. Computers & Education, 54(4), 1054–1067. http://doi.org/10.1016/j.compedu.2009.10.010
Sharpe, G. W. (1976). Interpreting the environment. John Wiley & Sons.
Skibins, J. C., Powell, R. B., & Stern, M. J. (2012). Exploring empirical support for interpretation’s best practices. Journal of Interpretation Research, 17(1), 25–44.
Stewart, E. J., Hayward, B. M., Devlin, P. J., & Kirby, V. G. (2003). The “place” of interpretation: A new approach to the evaluation of interpretation. Tourism Management, 19(3), 257–266.
Trotter, R. T. (2014). Monster time and other ethnographic insights at Wupatki National Monument. In G. E. Machlis & D. R. Field, On Interpretation: Sociology for Interpreters of Natural and Cultural History (pp. 130–149). Corvallis, Oregon: Oregon State University Press.
Wearing, S., & Neil, J. (2013). Ecotourism. Routledge.
Weiler, B., & Ham, S. H. (2010). Development of a research instrument for evaluating the visitor outcomes of face-to-face interpretation. Visitor Studies, 13(2), 187–205. http://doi.org/10.1080/10645578.2010.509697
Wiles, R., & Hall, T. (2003). Understanding visitor attitudes, beliefs, and motivations about feeding wildlife: A literature synthesis and recommendations for developing signs to deter wildlife feeding. Moscow, Idaho, USA: University of Idaho, Department of Conservation Social Sciences.
Zeppel, H., & Muloin, S. (2008). Conservation benefits of interpretation on marine wildlife tours. Human Dimensions of Wildlife, 13(4), 280–294.