Journal of Interpretation Research
Volume 23, Number 1
Measuring Elaboration and Evaluating Its Influence on Behavioral Intentions
Zachary D. Miller, Ph.D.
806 Donald H. Ford Building
Pennsylvania State University
University Park, PA 16802
(916) 622-0636
zdm9@psu.edu
Wayne Freimund, Ph.D.
Department of Parks, Recreation, and Tourism Management
Clemson University
Robert B. Powell, Ph.D.
Department of Parks, Recreation, and Tourism Management
Department of Forestry and Environmental Conservation
Clemson University
Abstract
The focus of this study is on developing a scale that measures elaboration as originally conceptualized by Vezeau et al. (2015), and then tests whether the elaboration scale is able to predict a variety of related behaviors. Confirmatory factor analysis was used to investigate the validity and reliability of the scale. The results suggest that the scale was successful in improving upon previous research in that all theoretical constructs were present in the second-order model of elaboration. Additionally, structural equation modeling was used to examine the predictive validity of the elaboration scale, which was successful in predicting a variety of related behaviors. This research advances the theoretical understanding and measurement of elaboration. Results can be used for evaluating interpretation efforts, including the assessment of programs and materials. Additionally, the results provide further evidence of elaboration as a measured construct and opens a variety of new avenues for research in environmental interpretation and informal education. Practitioners can use this research to reinforce or change attitudes and behaviors of visitors to those more consistent with an agency or organization mission by promoting interest, awareness, and cognitive engagement (collectively termed elaboration) in their interpretive products.
Introduction
Interpretation, or informal education, is an important management strategy for protecting valuable resources, reducing environmental impact, and keeping visitors safe in parks and protected areas around the world. With a recent surge in visitation to national parks in the US, developing effective interpretation programs has perhaps never been more important. For instance, in 2015, 51 national parks in the US broke their visitation records, and the national park system as a whole saw record-breaking levels of visitation with over 300,000,000 recreation visits (NPS, 2017a). With such high levels of visitation in national parks, managers need to be able to develop effective interpretation strategies to help them achieve their management goals. Interpretation is a valuable management tool for a variety of different reasons. For instance, in many large wilderness parks it is often impractical to have more direct means of management, like enforcement, due to limited staff and funding. Additionally, many visitors prefer interpretation-based management strategies over more direct management approaches, such as permitting or restrictions (Manning, 2011). Lastly, over-regulation may infringe on some of the social values associated with wilderness settings (Manning, 2003). For these reasons, interpretation is likely to remain a cornerstone of the management techniques used in park and protected areas.
Research suggests that interpretation, when applied appropriately, can be highly successful at influencing visitor behaviors to address management issues in parks and protected areas (Brown, Ham, & Hughes, 2010; Ham, 2013). Part of the success of interpretation depends on how much visitors “elaborate” on a message (Petty & Cacioppo, 1986; Ham, 2013). Elaboration, a thoughtful processing of information defined as raised levels of interest, awareness, and cognitive engagement, is a crucial antecedent to behavior change or pro-social behavior (Petty & Cacioppo, 1986; Vezeau et al., 2015). However, scales that measure the concept of elaboration are lacking. This is important because an operationalization of elaboration would allow us to evaluate if different interpretation methods are effective in promoting elaboration and ultimately influencing visitors’ behaviors. Only one research project has attempted to construct an elaboration scale, but measurement challenges presented themselves and ultimately rendered the scale incomplete (Vezeau et al., 2015). Therefore, this current research focuses on improving the measurement of elaboration first proposed by Vezeau et al. (2015) and examining if the scale has practical use in predicting a variety of related behaviors. In doing so, this research provides a better understanding of elaboration in the context of interpretation.
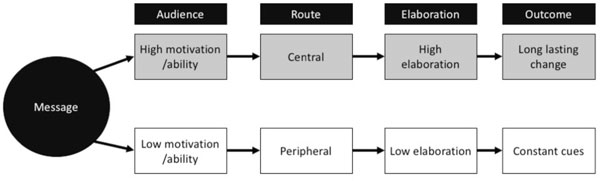 Figure 1: Elaboration likelihood model (adapted from Kenrick, Neuberg, & Cialdini, 2002; Petty & Cacioppo, 1986).
Theoretical Framework
Interpretation generally has three desired outcomes; it can enhance experiences, impact attitudes, and change negative behavior (Ham, 2013). The elaboration likelihood model (ELM) is a useful theoretical framework for understanding the last two outcomes (e.g., impacting attitudes and changing negative behavior), which are related. The elaboration likelihood model is concerned with impacting attitudes, and attitude change can also lead to behavior change (Ajzen, 1991; Petty & Cacioppo, 1986). Collectively, this type of interpretation that tries to reinforce or change attitudes and behaviors to those more consistent with an agency or organization mission is called persuasion.
According to ELM, there are two routes to persuasion: the central and the peripheral routes (Petty & Cacioppo, 1986; Figure 1). The central route is taken by people who are motivated and able to process a message and results in logical, careful consideration, the source of the term elaboration (Petty & Cacioppo, 1986). However, if people are unmotivated, unable, or unwilling to engage in such careful consideration and thoughtful processing, the peripheral route of persuasion may be more likely to impact attitudes (Petty & Cacioppo, 1986). In the central route, the content of a message plays a major role in persuasion (Petty & Cacioppo, 1986). However, the peripheral route of persuasion relies on subtle and often subconscious cues. For instance, the number of arguments in a persuasive message, the authority from which the message comes, and the conditions under which the message is presented are more important for the peripheral route to persuasion (Petty & Cacioppo, 1986). Although the routes are presented as a dichotomy, it is likely that people use both (in varying levels) to process a message (Petty, Wegener, & Fabrigar, 1997). For instance, both the number of arguments and the strength of the message may simultaneously work together in persuasion.
Although persuasion can occur through either route, there are some notable differences. For instance, although peripheral routes to persuasion can be effective for a short period of time, attitude changes that result from this route tend to be less salient and less enduring, and are easily affected by future messages (Petty, McMichael, & Brannon, 1992). Attitude changes acquired through the central route of persuasion tend to be more salient, durable over time, indicative of behavior, and resistant to future messages due to higher levels of elaboration (Petty et al., 1992). For these reasons, the central route to persuasion is generally preferred (Petty et al., 1992).
Research by Vezeau et al. (2015) at Great Smoky Mountain National Park provided an early attempt at scale development in measuring elaboration. Vezeau et al. (2015) proposed the concept of elaboration as a quantifiable, multi-dimensional concept consisting of interest, awareness, and cognitive engagement as suggested by theory (Petty & Cacioppo, 1986). The results provided substantial evidence that elaboration can be quantified. In addition, the elaboration scale was highly predictive of behavioral intentions, making it a useful framework for evaluating interpretation efforts. Removing the dichotomy of the ELM and replacing it with a continuous variable creates a more realistic elaboration concept by changing the question from if elaboration occurred to how much elaboration occurred (Petty et al., 1997).
This current research is designed to construct a more theoretically complete elaboration scale by adapting concepts (e.g., interest, awareness, cognitive engagement) from Vezeau et al.’s (2015) research. In Vezeau et al.’s (2015) research, the awareness construct displayed low variance. Because variance is necessary for scale development, awareness was dropped from the full model, leaving cognitive engagement and interest as the only factors of elaboration. Although still predictive of intended behaviors, elaboration as measured in the study was missing an important theoretical component (awareness) as originally conceptualized. This current research seeks to confirm the model originally proposed by Vezeau et al. (2015) and test its predictive validity.
Study site and context
To further explore the concept of elaboration and its impacts on behaviors, this research uses bear safety as a frame of reference. This includes the development of a bear safety elaboration scale, a bear safety behavioral intentions scale, and an evaluation of the relationship between bear safety elaboration and its impact on behavioral intentions. Bear safety behaviors are actions that visitors can adopt to increase their physical safety from bears while hiking.
This research was conducted in Yellowstone National Park (YNP). Yellowstone National Park is one of the most visited national parks in the US, receiving more than four million visitors annually (NPS, 2017b). Well-known for its geological uniqueness and numerous species of large, charismatic wildlife, YNP also offers a multitude of recreation opportunities, including hiking. However, with millions of visitors and large, free-roaming wildlife, conflicts do occur. This includes conflicts with bears. Yellowstone National Park is one of the few places left in the contiguous US that is inhabited by both grizzly and black bears. Although both species can be a threat to people, it is the grizzly bear that poses the most risk to humans (NPS, 2017c). Hiking in grizzly bear country should be done with special precautions that are unique when compared to hiking in areas where only black bears are present. For instance, while carrying and knowing how to use bear spray is recommended in areas where grizzly bears are present (NPS, 2015d), this is usually not recommended in areas where only black bears are present. In fact, in some areas where black bear and human interactions are common (like Yosemite National Park in the Sierra Nevada mountains of California), it is illegal to carry bear spray (NPS, 2015e). For this reason, the bear safety messaging at YNP focuses on behaviors more specific to grizzly bears. However, many of the bear safety behaviors overlap with regard to species of bear.
Of all the wildlife in YNP, the grizzly bear tends to be the species about which people are most concerned (Olliff & Caslick, 2003). There is good reason for this, as incidents with grizzly bears are more likely to result in human death than with any other wildlife species in the park. Incidents with grizzly bears (defined as physical contact between a person and a bear) occur at a rate of about one per year in YNP, and happen almost exclusively in backcountry (undeveloped) areas, such as hiking trails (NPS, 2017c). Deaths from bear attacks are rare in YNP, with only three deaths occurring between 1963 and 2010 (NPS, 2017c). However, between 2011 and 2015, three visitors were killed by grizzly bears inside the park in separate incidents (NPS, 2017c). With the recent spike in deaths from bear incidents and growing numbers of visitors, this research focused on understanding how interpretation is influencing visitors’ bear safety behaviors. This research is part of a broader project that examined how interpretation influences visitors’ bear safety behaviors. This paper focuses only on scale construction and predictive validity.
Methods
Conceptualization and measurement
An onsite intercept questionnaire administered via tablet collected data from respondents for the broader study. The portions of the questionnaire that pertain to this research involved two sections: an elaboration section and a bear safety behavioral intentions section.
Bear safety behaviors
Using information provided by YNP, including the YNP website, signs, brochures, maps, and other forms of communication, researchers identified six different bear safety behaviors of interest. Because it is often difficult to measure actual behaviors, this research conceptualized the measures as behavioral intentions, which are an antecedent to actual behavior (Ajzen, 1991). To measure behavioral intentions, hikers were asked, “How likely are you to do the following things while hiking in Yellowstone National Park?” The six items were: 1) make noise by clapping or shouting, 2) personally carry bear spray, 3) look for signs of bears, like scat and tracks, 4) hike in a group of three or more people, 5) carry bear spray in an accessible place, like a hip holster, and 6) run if you see a bear (item was reverse coded). Responses were measured on a 7-point Likert-type scale, where 1=highly unlikely, 2=unlikely, 3=slightly unlikely, 4=neither, 5=slightly likely, 6=likely, and 7=highly likely.
Elaboration
The conceptualization of elaboration on the questionnaire was guided by Vezeau et al. (2015) and was divided into three different portions: interest, awareness, and cognitive engagement. In this research, we sought to reduce skewness and increase variance to overcome previous issues in Vezeau et al’s. (2015) research using a variety of techniques. These included using extreme values/strong wording and unidirectional scaling (DeVellis, 2003; Klockars & Hancock, 1993; Munshi, 2014; Peterson & Wilson, 1992). All the measures for interest, awareness, and cognitive engagement were conceptualized using information provided by YNP to visitors from a variety of communication sources (e.g., the YNP website, signs, brochures, maps, etc.).
Awareness
Awareness is defined in this research as a general, rather than specific, cognizance of different concepts relating to bear safety in YNP (Vezeau et al., 2015). This is similar to other research using awareness as a construct (Kollmuss & Agyeman, 2002; Vezeau, 2015). Previous research found that awareness is a different concept than knowledge, is predictive of behaviors, and has been used to evaluate a variety of programs (Musser & Malkus, 1994; Schultz 2000, 2001; Stern, Powell, & Ardoin, 2008; Stone, Barnes, & Montgomery, 1995; Vezeau et al., 2015). To measure awareness, visitors were asked, “How aware are you of the following items?” Five different items were developed to measure awareness of bear safety. The items were: 1) ways to increase your safety while hiking in bear country, 2) techniques that can help you avoid negative encounters with bears, 3) how hiking in grizzly bear country is different than hiking in other areas, 4) resources you can use to keep you safe while hiking in bear country, and 5) things you can do to decrease your risk of a bear attack while hiking. Responses were recorded on a 5-point Likert-type scale, where 1=not at all aware, 2=somewhat aware, 3=very aware, 4=extremely aware, and 5=completely aware.
Interest
This study defines interest as wanting to learn about items related to bear safety (Vezeau et al., 2015). Interest in learning has previously been used in the evaluation of environmental programs and is associated with behavior change (Lück, 2015; Stern et al., 2008; Vezeau et al., 2015; Werner, 1999). To measure interest, visitors were asked, “How interested are you in learning about the following items?” Six different items were developed to measure day hikers’ interest in learning about bear safety. These items were: 1) staying safe while hiking in the presence of bears, 2) knowing how to act if you see a bear, 3) proper equipment while hiking in areas where bears may be present, 4) how to increase your alertness to bears in an area, 5) how to avoid bear encounters while hiking, and 6) how to interpret bear behaviors. Responses were recorded on a 5-point Likert-type scale, where 1=not at all interested, 2=somewhat interested, 3=very interested, 4=extremely interested, and 5=completely interested.
Cognitive engagement
In this study, cognitive engagement is defined as the amount someone spent thinking about aspects of bear safety, and is only the second study to measure this concept (Vezeau et al., 2015). Visitors were asked, “How much have you thought about the following items?” Six different items were developed to measure cognitive engagement for day hikers. These items were: 1) appropriate behaviors while hiking in the presence of bears, 2) what hikers can do to stay safe from bears while hiking, 3) how to have an enjoyable experience while hiking in bear country, 4) the benefits of taking safety precautions while hiking in bear country, 5) encountering bears while hiking, and 6) how hikers can avoid bears while hiking. Responses were recorded on a 5-point Likert-type scale, where 1=not at all, 2=somewhat, 3=a moderate amount, 4=very much, and 5=a great deal.
Data collection
Day hikers (as opposed to overnight backpackers, or bicyclists on one trail) were of specific interest in this research because they have no point of mandatory contact and are likely less experienced than overnight backpackers. Additionally, the last three deaths from bears in YNP were all day hikers. Intercept survey techniques were used to collect data from day hikers on two trails in YNP. The two trails were selected in conjunction with park managers and served as a sampling frame. Trained university researchers systematically sampled day hikers and asked them to participate in the research by completing the survey on a tablet. If groups of hikers were intercepted, the person with the most recent birthday (not date of birth) in the group was asked to participate in the research. Data collection represented all days of the week during daylight hours from July 1 to August 15. Researchers intercepted 777 day hiker groups, in which 14 (1.8%) did not speak enough English to complete the survey. From the remaining 763 groups, 647 individuals agreed to participate in the survey (response rate=85%). Two variables were used to evaluate non-response bias: age and U.S. residency/citizenship. There were no significant differences (p<0.05) between respondents and non-respondents regarding these variables.
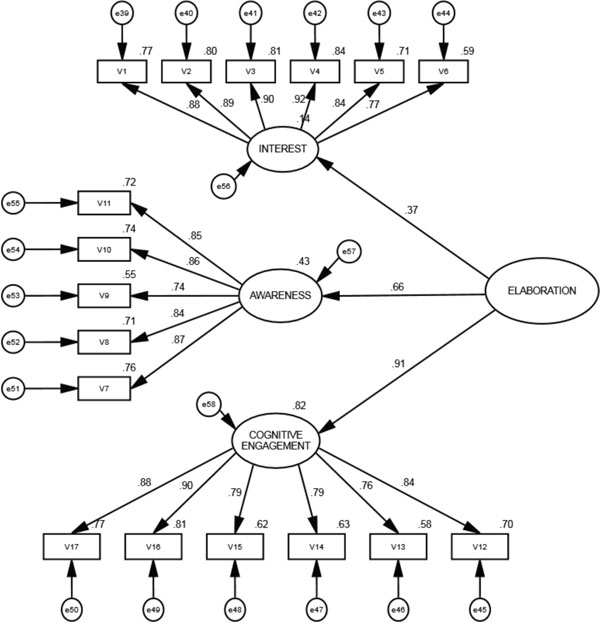 Figure 2: Second-order CFA of elaboration. All loadings are standardized and statistically significant (p<0.01). Fit statistics: χ2 =331.041, df=116, p<0.001; BSboot, p=0.002; RMSEA=0.052, p-close=0.091; SRMR=0.0267; CFI=0.975; TLI=0.977. See Table 1 for corresponding variable codes.
Analysis
SPSS and AMOS were used to perform statistical analyses. During data cleaning, attention was paid to univariate outliers, missing data, and skewness of variables. Three different approaches were used during the analysis. These include confirmatory factor analysis (CFA), principal axis factoring (PAF), and structural equation modeling (SEM). AMOS was used for all SEM and CFA procedures, and SPSS was used for all other procedures. Maximum likelihood (ML) estimation was used for all SEM and CFA procedures.
During data screening, it was found that most variables had one or two missing data points. To determine if there was a pattern to the missing data, Little’s missing completely at random (MCAR) test was used. Results indicated that there was no pattern to the missing data (χ2=566.79, df=585, p=0.698). To be as conservative as possible, cases with missing data were deleted listwise instead of imputed. This left a final sample size of n=600.
Confirmatory factor analysis is a form of SEM used to test an a priori specified structure of the relationship among observed variables and latent variables (Kline, 2011). This research used CFA to examine a second-order model of elaboration using raw data, where interest, awareness, and cognitive engagement were first-order latent variables that are reflective of an underlying elaboration factor (Figure 2). Maximum likelihood estimation assumes a multivariate normal distribution of the data, and there were some indications that this assumption was violated (i.e., univariate skewness, Mardia’s coefficient = 108.478, critical ratio=52.272). To correct for this, bootstrapping (a resampling method that creates a pseudo-population from the sample) was applied to all CFA and SEM procedures, and bias-corrected confidence intervals (95%) were used when reporting significance to reduce the chance of Type I errors (Byrne, 2001). Generally, standardized loadings of variables measuring a factor should be statistically significant and >.30, with values >0.60 considered “high” (Kline, 1994). Additionally, goodness-of-fit (GOF) statistics allow researchers to examine how well the data matches the specified model in CFA and SEM. In this research, we provide several GOF statistics for each model, including both relative and absolute fit measures.
Absolute fit statistics examine the relationship between the implied and hypothesized covariance matrices and include χ2, the root mean square error of approximation (RMSEA), and the standardized root mean square residual (SRMR). As is customary, the χ2 statistic is reported for the model. In addition, the Bollen-Stine bootstrap χ2 (BSboot; a χ2 test that accounts for the bootstrapping procedure) is reported. It is interpreted in the same way as the normal χ2. However, because χ2 is essentially a test of statistical significance, larger samples (n>200) make it likely that it will be rejected due to greater statistical power (Hooper, Coughlin, & Mullen, 2008). Therefore, other fit statistics are generally more relied upon for assessing model fit. RMSEA is a “badness of fit” index where values closer to 0 indicate a better fit (Kline, 2011, p. 205). RMSEA values less than 0.10 are considered acceptable, with RMSEA < 0.05 indicative of an excellent fit (Brown & Cudeck, 1993; Kline, 2011). With RMSEA, a p-close test along with the 90% confidence interval is provided. The p-close test evaluates whether the RMSEA has a high likelihood of actually being less than 0.05, with values of p>0.05 concluding that the model is “close fitting” (Kline, 2011). SRMR transforms the covariance matrices of the hypothesized and independence models into correlation matrices. The difference between these matrices is the mean absolute correlation residual, which is essentially what SRMR reflects (Kline, 2011). Generally, values of <0.08 are considered acceptable for SRMR, with values closer to 0 indicative of a better fit (Hu & Bentler, 1999).
Relative fit statistics (also called comparative fit statistics) examine how much the hypothesized model differs from an independence model (one where there is no relationship among variables). These fit statistics include the comparative fit index (CFI) and the Tucker-Lewis index (TLI). CFI compares the independence model to the hypothesize model (Kline, 2011). Values closer to 1 indicate a better fit, with values >.90 indicating an acceptable fit, and >0.95 indicative of an excellent fit (Hu & Bentler, 1998). TLI is fairly similar to CFI, except it compares the χ2 value of the hypothesized model to the independence model, while also incorporating degrees of freedom (Kline, 2011). TLI is interpreted in a similar way to CFI. Invariance testing is used to further examine the validity of the elaboration scale (Byrne, 2001; Kline 2011).
The Rho coefficient (or Raykov’s composite reliability) was used to determine the reliability of multidimensional measures for all models and was calculated as per Graham (2006) in AMOS. Rho has numerous advantages over Cronbach’s alpha when evaluating scale reliability in CFA and SEM. Most important is the fact that Cronbach’s alpha assumes that the items measuring a latent variable are tau-equivalent, or have equal loadings. Violating this assumption tends to incorrectly estimate the actual reliability of items (Graham, 2006; Miller, 1995). Rho accounts for differential loadings among observed variables of a latent variable and is interpreted in a similar fashion to Cronbach’s alpha, where Rho>0.60 is considered acceptable (Gay, 1991; Graham, 2006). Lastly, invariance testing, an additional check on validity, is used to examine the structure of the model across independent groups.
Principal axis factoring was used to identify the underlying structure of the bear safety behavioral intentions. We used a PAF over a CFA because the items in the scale had never been developed before, and no explicit structure was determined a priori. Assumptions about the appropriateness of using PAF were checked using the Keiser-Meyer-Olkin (KMO) statistic (KMO>0.50) and Bartlett’s test of sphericity (p<0.05). A scree plot was used to determine how many factors to maintain. Varimax rotation was applied to the PAF to help interpret the results. Along with face validity, loadings of >0.30 were used to determine the factor that each item belonged to (Kline, 1994). Reliability for the items that loaded onto the same factor was assessed using Cronbach’s alpha, as Rho could not be calculated using exploratory factor analysis. A Cronbach’s alpha ¬>0.60 was considered acceptable (Gay, 1991). The PAF was conducted to inform the structure in the SEM model to keep the SEM in the “spirit” of a confirmatory, not exploratory, process.
The last step in analysis involved a SEM that merged both the elaboration scale and the bear safety behavioral intentions. This was done to ensure the predictive validity of the elaboration scale, which is in line with the theoretical concepts of the ELM (Petty & Cacioppo, 1986). Bootstrapping was also applied to the SEM procedures. Like the CFA, fit indices and factor loadings are reported. Lastly, standardized path coefficients are reported, along with their statistical significance (using bias-corrected confidence intervals [95%] to report significance), between elaboration and bear safety behavioral intentions.
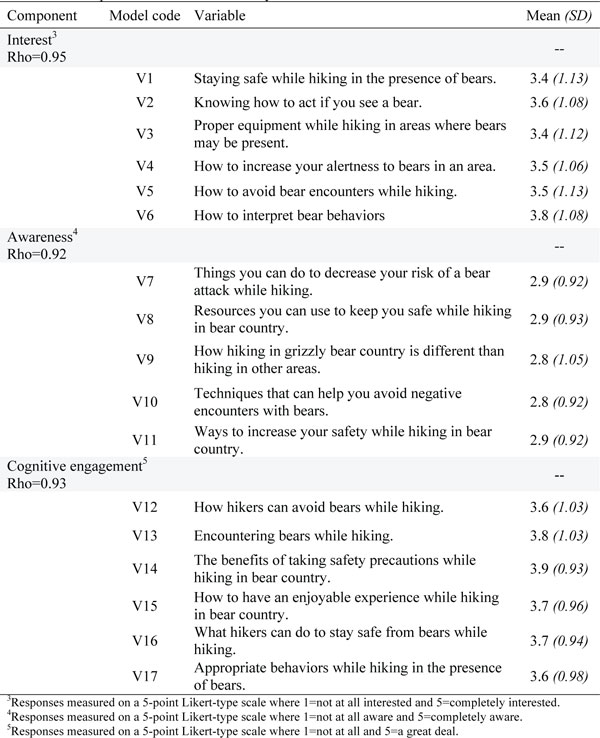 Table 1: Descriptive statistics and reliability for elaboration measures
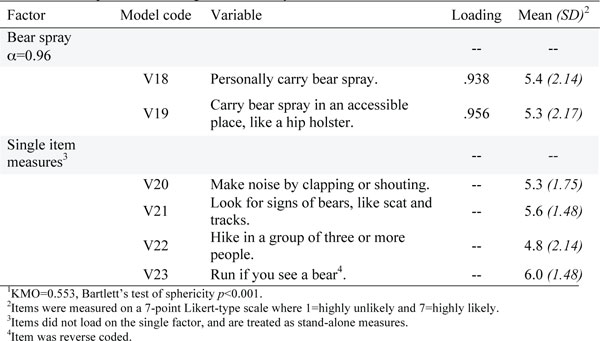
Table 2: Principal axis factoring for bear safety behavioral intentions1
Results
Sample characteristics
Overall, respondents were about evenly split regarding gender, with 47.5% being female and 52.5% being male. The age of respondents ranged from 18 to 83 years of age. The mean age of respondents was 40.8 years, and the median was 40 years. Over 91% of respondents reported being white, which is similar to other research conducted in national parks. Asians were the next largest group and consisted of about 6.4% of the sample, followed by people who reported being of more than one race (1.6%). People who identified as Hispanic or Latino made up 3.4% of the sample. In terms of education, the sample was highly educated, with 39.1% of respondents possessing a graduate degree and 40.4% possessing a Bachelor’s degree. Over 90% of respondents had at least some college. Eighty-one percent of respondents were permanent residents or citizens of the United States. Forty-seven out of the 50 states in the US were represented, as was the District of Columbia. Respondents came from five of the seven continents on the globe (Antarctica and Africa were not represented in the sample). The most common non-US countries where respondents lived were Canada (2.1%), France (2%), Germany (1.8%), Switzerland (1.7%), and the Netherlands (1.2%).
Measurement model for elaboration
Descriptive statistics and variable codes for the observed variables in the model, as well as Rho reliability for first-order factors, are provided in Table 1. Rho (0.92 to 0.95) indicated that the first-order factors were reliably measuring their underlying constructs. The second-order CFA provided ample evidence that the variables measured their intended first-order factors (interest, awareness, cognitive engagement) and that these first-order factors measured the concept of elaboration (Figure 2). The data had good fit to the model. Both χ2 (χ2 =331.041, df=116, p<0.001) and BSboot (p=0.002) were significant, as was expected with a large sample size. All other fit statistics indicated a good to excellent fit for the model (RMSEA=0.052, p-close=0.091; SRMR=0.0267; CFI=0.975; TLI=0.977), and all loadings were statistically significant (p<0.01) and above the generally accepted levels. Rho reliability for constructs measuring elaboration also supported that the items reliably measured the elaboration construct (Rho=0.68).
Invariance testing. Invariance testing is used to examine how a scale functions across independent groups and is an additional validity check in scale development (Kline, 2011). For this process, the sample was randomly divided via SPSS command into two independent and roughly equal groups (group 1, n=317; group 2, n=283) (Kyle, Graefe, & Manning, 2005). In this research, two types of invariance testing are used: configural and metric invariance. Configural invariance ensures that the model structure is equivalent across multiple groups and is tested by simultaneously comparing the two groups in a multi-group CFA (Byrne, 2001; Vezeau et al., 2015). Results from the configural invariance test indicated that the structure of the model was the same between the two groups (χ2 =485.376, df=232, p<0.001; BSboot, p=0.002; RMSEA=0.043, p-close=0.988; SRMR=0.031; CFI=0.97; TLI=0.965). Metric invariance is a more rigorous validity check and examines the equality of unstandardized factor loadings across groups (Kline, 2011; Vezeau, 2015). This is done by comparing multiple models: one in which factor loadings are unconstrained among the groups (reported above) and one in which factor loadings are constrained to be equal among the groups (constrained model: χ2 =493.704, df=249, p<0.001; BSboot, p=0.002; RMSEA=0.041, p-close=0.999; SRMR=0.036; CFI=0.971; TLI=0.969). A Chi-square difference test indicated that there was no significant different between the two models (χ2 difference= 8.328, df= 17, p=0.96). Further analysis showed that there was no significant difference (p<0.05) among any of the factor loadings between the two groups. In summary, the bear safety elaboration scale displayed both configural and metric invariance.
Principal axis factoring for bear safety behavioral intentions
The assumptions for using PAF were met (KMO=0.553 and Bartlett’s test of sphericity p<0.001). Examination of the scree plot showed that only one factor could be identified from the data. No rotation could be applied since there was only one factor. Table 2 shows the results of the PAF as well as descriptive statistics for all bear safety behavioral intentions measures. Three of the bear safety behavioral intention variables loaded on the factor: “personally carry bear spray” (loading=0.938), “carry bear spray in an accessible place, like a hip holster” (loading=0.956), and “Look for signs of bears like scat and tracks” (loading=0.34). The last variable (“Look for signs of bears, like scat and tracks”) was removed from the factor due to face validity issues (i.e., the other two factors are clearly related to bear spray) and its comparatively low factor loading. Additional support for the two-item factor (“personally carry bear spray” and “carry bear spray in an accessible place, like a hip holster) came from the high Cronbach’s alpha (α=0.96). This factor was named “bear spray,” and all other items were treated as stand-alone measures of bear safety behavioral intentions during further analysis.
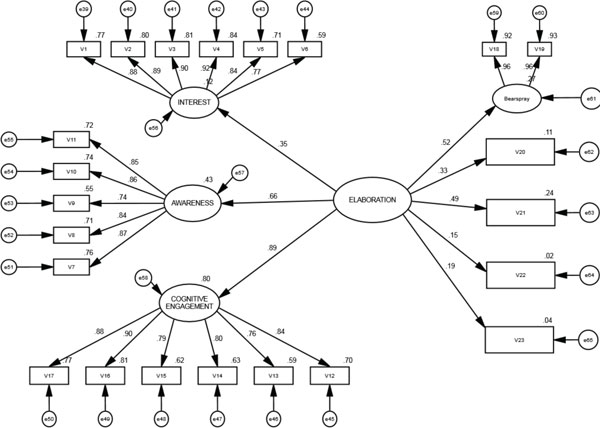 Figure 3: SEM of the relationship between elaboration and bear safety behaviors. Fit statistics: χ2 =331.041, df=116, p<0.001; BSboot, p=0.002; RMSEA=0.050, p-close=0.531; SRMR=0.0413; CFI=0.967; TLI=0.963. All loadings and paths were statistically significant (p<0.01). See Tables 1 and 2 for corresponding variable codes.
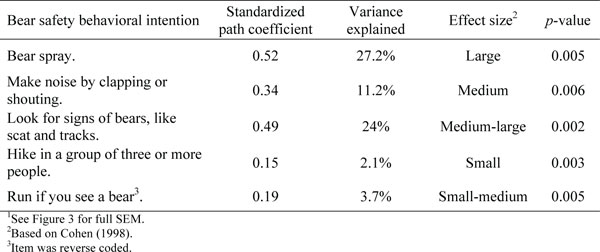
Table 3: Effect of elaboration on bear safety behavioral intentions
Structural model of elaboration and bear safety behavioral intentions
Using the results from the CFA and the PAF, a SEM was designed to test the predictive validity of the elaboration construct on the bear safety behavioral intentions identified in the PAF (Figure 3). Fit statistics supported that there was a good to excellent fit between the model and the data. Like the CFA, both the χ2 (χ2 =559.910, df=226, p<0.001) and BSboot (p=0.002) were significant. All other fit statistics supported the model (RMSEA=0.050, p-close=0.531; SRMR=0.0413; CFI=0.967; TLI=0.963). Elaboration had a significant, positive effect on all bear safety behavioral intentions (Table 3). The largest effects were found in the latent bear spray factor and looking for signs of bears, like scat and tracks. A medium effect was found on making noise by clapping or shouting. Small to medium effects were found for hiking in a group of three or more people and running if you see a bear.
Discussion
The purpose of this research was to develop an elaboration scale in which all theorized constructs (interest, awareness, and cognitive engagement) were present, and to test the elaboration scale’s predictive validity. In doing so, the research investigates the relationship between elaboration and behavioral intentions, and provides a way to evaluate the influence of future interpretation efforts.
The CFA and reliability of the bear safety elaboration measures indicated a good to excellent fit. Additionally, all three theorized constructs (interest, awareness, and cognitive engagement) measured the concept of elaboration. This was an improvement over Vezeau et al.’s (2015) model, in which awareness was not included in the model due to variance issues. The interest dimensions in the bear safety elaboration scale had a lower loading (0.37) when compared to other first-order factors. This indicates that, at least for bear safety elaboration, interest is likely a less important indicator of elaboration than either cognitive engagement or awareness. From an overarching theoretical view, this does not mean that interest is not as important as awareness or cognitive engagement to elaboration (Vezeau et al., 2015). Indeed, Vezeau et al.’s (2015) model found both interest and cognitive engagement had relatively high factor loadings. Instead, it is likely that in this empirical case, interest was not as important to bear safety elaboration (Vezeau et al., 2015). Although the reasons for this are not clear, it may simply be that awareness and cognitive engagement are relatively more important for bear safety elaboration. Considering the results from the bear safety elaboration scale, the inclusion of all first–order elaboration factors (interest, awareness, and cognitive engagement) is likely a sounder way of measuring elaboration than previously done. At this nascent stage, any future research that develops scales for measuring elaboration in different contexts and populations will continue to help researchers understand the components of elaboration measurement.
The PAF of bear safety behavioral intentions identified only one factor (bear spray behavioral intentions). The results from this suggest that bear safety behaviors are mostly separate behaviors. For instance, hiking in a group of three or more people is a distinct behavior from making noise by clapping or shouting. This is likely useful to future research. For instance, theoretical frameworks, such as the theory of planned behavior (Ajzen, 1991), need to be applied separately to each type of bear safety behavior. This means that bear spray behaviors may have different influences (e.g., attitudes, subjective norms, perceived behavioral control) than hiking in a group of three or more people.
From both a theoretical and applied perspective, elaboration should be able to predict behavioral intentions (Ajzen, 1991; Ham, 2013; Petty & Cacioppo, 1986). Results indicated that elaboration significantly predicted all measured bear safety behavioral intentions. However, it should also be acknowledged that there is a considerable amount of unexplained variance remaining for several bear safety behavioral intentions. Even with this acknowledgement, this research provides further evidence that the elaboration construct, as measured by interest, awareness, and cognitive engagement, is conceptually valid. Additionally, although bear safety behaviors may have different influences, it appears that interpretation strategies based on raising levels of elaboration can influence multiple, related behaviors, such as sustainability (see Vezeau et al., 2015) or, in this instance, bear safety. This has an important implication for interpretation programs. If the goal is to make a difference by impacting behaviors, then focusing on factual knowledge alone is unlikely to be successful (Miller, Freimund, Metcalf, & Nickerson, 2017; Schultz, 2011). Instead, these programs should focus on increasing interest, awareness, and cognitive engagement (i.e., elaboration) related to their topics.
Research needs to continue to develop elaboration scales in a variety of contexts to continue to refine our understanding of elaboration as a measured concept. Currently, we are unaware of how elaboration scales generalize to other concepts, or even how this bear safety elaboration scale generalizes to non-Yellowstone National Park populations. Both this study and Vezeau et al.’s (2015) research were conducted in national parks in the US. Developing elaboration measures for populations outside of national parks and the US may be particularly insightful. Additionally, although elaboration influences behavioral intentions, it is yet to be revealed how it is doing so. Empirically modeling elaboration with other theories about behavior, like the theory of planned behavior (Ajzen, 1991), can help further understand the relationship between interpretation strategies and behaviors. Lastly, elaboration scales need to be used to assess the impact of different interpretation strategies, likely in a pre-and-post design. In these studies, close attention should be paid to the change not only of the second-order elaboration factor, but also among the first-order factors (interest, awareness, and cognitive engagement). Along with this, an assessment of the long-term effects of elaboration needs to be conducted. Lastly, research should continue to explore the link between behavioral intentions and actual behavior (Miller, 2017).
Conclusion
This research provided further evidence of elaboration as a measured concept by constructing a more theoretically complete elaboration scale. In this research, higher levels of elaboration were found to have a positive impact on a variety of related behavioral intentions. The insights from this study indicate that when trying to impact attitudes or change behaviors through interpretation, creating a strategy designed around the concept of elaboration can be highly effective. Specifically, creating strategies that raise interest, awareness, and cognitive engagement are likely to be useful. Additionally, the elaboration scale developed in this research can provide future opportunities to researchers that would further our understanding of how interpretation impacts behaviors.
References
Ajzen, I. (1991). The theory of planned behavior. Organizational Behavior and Human Decision Processes, 50, 179–211.
Brown M.W., & Cudeck R. (1993). Alternative ways of assessing model fit. In: Bollen K.A., Long J.S., (Eds.). Testing structural equation models. Newbury Park, CA: Sage; 1993. pp. 136–162.
Brown, T. J., Ham, S. H., & Hughes, M. (2010). Picking up litter: An application of theory-based communication to influence tourist behaviour in protected areas. Journal of Sustainable Tourism, 18(7), 879–900.
Byrne, B. M. (2001). Structural Equation Modeling with AMOS: Basic Concepts, Applications, and Programming. Mahwah, N.J.: Lawrence Erlbaum Associates.
Cohen, J. (1988). Statistical Power Analysis for the Behavioral Sciences (2nd ed.). Hillsdale, NJ: Lawrence Earlbaum Associates.
DeVellis, R. (2003). Scale Development: Theory and Applications. Thousand Oaks, CA: Sage Publications.
Gay, L.R. (1991). Educational Evaluation and Measurement: Competencies for Analysis and Application. New York: MacMillan Publishing Company.
Graham, J.M. (2006). Congeneric and (essentially) tau-equivalent estimates of score reliability: What they are and how to use them. Educational and Psychological Measurement, 66(6), 930–944.
Ham, S. (2013). Interpretation: Making a difference on purpose. Golden, CO: Fulcrum Publishing.
Hooper, D., Coughlan, J., & Mullen, M.R. (2008). Structural equation modelling: Guidelines for determining model fit. Electronic Journal of Business Research Methods 6(1), 53–60.
Hu, L., & Bentler, P.M. (1998). Fit indices in covariance structure modeling: Sensitivity to underparameterized model misspecification. Psychological Methods, 3, 424–453.
Hu, L., & Bentler, P. M. (1999). Cutoff criteria for fit indexes in covariance structure analysis: Conventional criteria versus new alternatives. Structural Equation Modeling: A Multidisciplinary Journal, 6(1), 1–55.
Kenrick, D. T., Neuberg, S. L., & Cialdini, R. B. (2002). Social Psychology: Unraveling the Mystery (2nd Ed.). Boston: Allyn & Bacon.
Kline, P. (1994). An Easy Guide to Factor Analysis. New York, NY: Routledge.
Kline, R. B. (2011). Principles and Practice of Structural Equation Modeling (3rd ed.). New York, NY: The Guillford Press.
Klockars, A. J., & Hancock, G. R. (1993). Manipulations of evaluative ratings. Psychological Reports, 73, 1059–1066.
Kollmuss, A., & Agyeman, J. (2002). Mind the gap: Why do people act environmentally and what are the barriers to pro-environmental behavior? Environmental Education Research 8(3), 239–260.
Kyle, G., Graefe, A., & Manning, R. (2005). Testing the dimensionality of place attachment in recreational settings. Environment and Behavior, 37(2), 153–177.
Lück, M. (2015). Education on marine mammal tours—But what do tourists want to learn? Ocean and Coastal Management, 103, 25–33.
Manning, R. (2003). Emerging principles for using information / education in wilderness management. International Journal of Wilderness, 9(1), 20–27.
Manning, R. (2011). Studies in outdoor recreation: Search and research for satisfaction (3rd ed.). Corvallis, OR: Oregon State University Press.
Miller, M.B. (1995). Coefficient alpha: A basic introduction from the perspectives of classical test theory and structural equation modeling. Structural Equation Modeling, 2, 255–273.
Miller, Z.D. (2017). The Enduring Use of the Theory of Planned Behavior. Human Dimensions of Wildlife, 22(6), 583–590.
Miller, Z.D., Freimund, W., Metcalf, E.C., & Nickerson, N. (2018). Targeting your audience: wildlife value orientations and the relevance of messages about bear safety. Human Dimensions of Wildlife, 23(3).
Munshi, J. (2014). A method for constructing Likert scales. SSRN Electronic Journal, (April), 1–12.
Musser, L.M., & Malkus. (1994). The children’s attitudes toward the environment scale. Journal of Environmental Education, 25(3), 22–26.
NPS. (2017a). National Park Service Certifies 2015 Visitation at 307 Million: Reports Annual Top 10 Lists and Other Highlights [Press release]. Retrieved from https://www.nps.gov/aboutus/news/release.htm?id=1784
NPS. (2017b). Yellowstone National Park: Visitation statistics. Retrieved from http://www.nps.gov/yell/planyourvisit/visitationstats.htm
NPS. (2017c). Bear-inflicted human injuries and fatalities in Yellowstone. Retrieved from http://www.nps.gov/yell/learn/nature/injuries.htm
NPS (2015d). Using bear spray to deter an aggressive bear. Retrieved from http://www.nps.gov/yell/learn/nature/bsdeter.htm
NPS (2015e). Weapons/Firearms. Retrieved from http://www.nps.gov/yose/planyourvisit/weapons.htm
Olliff, T., & Caslick, J. (2003). Wildlife – human conflicts in Yellowstone: When animals and people get too close. Yellowstone Science, 1(18), 18–22.
Peterson, R.A., & Wilson, W.R. (1992). Measuring customer satisfaction: Fact and artifact. Journal of the Academy of Marketing Science, 20(1), 61–71.
Petty, R. E., & Cacioppo, J. T. (1986). The elaboration likelihood model of persuasion. Advances in Experimental Social Psychology, 19, 123–205.
Petty, R.E., McMichael, S., & Brannon, L.A. (1992). The elaboration likelihood model of persuasion: Applications in recreation and tourism. In M.J. Manfredo (Ed.), Influencing Human Behavior: Theory and Applications in Recreation, Tourism, and Natural Resources Management (pp. 77–101). Champaign, IL: Sagamore Publishing.
Petty, R.E., Wegener, D.T., & Fabrigar, L.R. (1997). Attitudes and attitude change. Annual Review of Psychology, 48, 609–47.
Schultz, P.W. (2000). Empathizing with nature: The effects of perspective taking on concern for environmental issues. Journal of Social Issues, 56(3), 391–406.
Schultz, P.W. (2001). The structure of environmental concern: Concern for self, other people, and the biosphere. Journal of Environmental Psychology, 21(4), 327–339.
Schultz, P.W. (2011). Conservation means behavior. Conservation Biology, 25(6), 1080–1083.
Stern, M.J., Powell, R.B., & Ardoin, N.M. (2008). What difference does it make? Assessing outcomes from participation in a residential environmental education program. The Journal of Environmental Education, 39(4), 31–43.
Stone, G., Barnes, J.H., & Montgomery, C. (1995). Ecoscale: A scale for the measurement of environmentally responsible consumers. Psychology and Marketing, 12(7), 595–612.
Vezeau, S.L., Powell, R.B., Stern, M.J., Moore, D.D., & Wright, B.A. (2015). Development and validation of two scales to measure elaboration and behaviors associated with stewardship in children. Environmental Education Research, (January), 1–22.
Werner, C.M. (1999). Psychological perspectives on sustainability. In E. Becker & T. Jahn (Eds.), Sustainability and the Social Sciences: A Cross-disciplinary Approach to Integrating Environmental Considerations into Theoretical Reorientation (pp. 223–242). New York: Zed Books.