Journal of Interpretation Research
Volume 23, Number 1
Can interpretive graphics influence visitor behavior in an exhibit space?
Allison M. Price, M.S.
Director of Learning Experiences
Lincoln Park Zoo
2001 N. Clark Street
Chicago, IL 60614
312-742-2056
aprice@lpzoo.org
Jessica C. Monahan, M.S.
Lincoln Park Zoo (formerly)
California Association of Museums (currently)
Rachel Bergren, M.S.
Lincoln Park Zoo (formerly)
The Marine Mammal Center (currently)
Keywords
signs, evaluation, visitor engagement, graphics, visitors, interactive
Abstract
Exhibit signage and graphics projects are most successful when they involve collaborative planning and formative evaluation throughout the process. Lincoln Park Zoo set out to combine interpretive best practices and visitor evaluation methods for the newly renovated eastern black rhinoceros yard in 2010. Evaluation methods included prototyping, visitor tracking, and informal interviews. After installation of the new graphics, visitor time spent looking at both the signs and the exhibit increased. Results were most significant among male visitors. The study indicates that hands-on non-personal media of this nature can have a significant effect on visitor behavior in an exhibit space. It also provides a model for making data-informed decisions regardless of limited budgets or resources.
Introduction
The purpose of interpretive elements at informal learning centers such as museums and zoos is to contribute to the overall visitor experience in a positive, enlightening, provocative, and meaningful way. As Beverly Serrell put it, “Good labels can attract, communicate, inspire, and help visitors get what they are seeking” (Serrell 1996). Interpretive graphics can be used to tell stories, contrast points of view, present interesting issues, or positively influence attitudes. Because they can sometimes be the only “educator” a guest encounters during their visit, it is important that exhibit signs be correct, compelling, respectful of both visitor and animal, and educational (Fogelberg 2014). They must also directly relate to the needs and desires of the learners in the space; signs that share what institutions want to tell rather than what guests want to know may fail to make any kind of meaningful connection between visitors and the exhibit in question (Screven, 1992). Beyond answering basic questions, Packer and Ballantyne note that signs that “reinforce visitors’ sense of wonder, awe, excitement,” and that encourage imagination, empathy, and reflection can enhance the long-term impact of visiting a zoo or aquarium (Packer & Ballantyne, 2010).
Of course, not all visitors read all signs. The content and form of labels and other interpretive graphics can influence visitors’ decisions to read and levels of comprehension; interactive interpretive signage can be more successful than simple flat panels at attracting visitors, holding their attention, and increasing learning (Bishop, Benusa, Screven, & Arndt 1993). Further, studies have shown that visitors will forgo reading a traditional, text-only opportunity if there is a competing opportunity to touch an object (Lindemann-Matthies & Kamer, 2006). However, interpretive professionals must not assume that visitors never read signs, as is so often casually stated. Although some research (and interpretation of said research) suggests that visitors do not spend much time reading labels, John Falk and Lynn Dierking contend that the research as a whole indicates that all visitors read at least some labels, emphasizing that location within the museum, stage in the visit when the label is encountered, and interest in the exhibit may all influence a visitor’s decision to read a particular sign (Falk & Dierking, 2013). Thus, given the potential value of interpretive signs in meeting an educational mission, it is critical that interpretive sites like zoos make their signs as compelling and relevant as possible, and strive to match the impact we often see from personal interpretation (Leftridge, 2006).

Figure 1: Original graphic panels at the rhino exhibit included no hands-on elements and did not offer visitors any information on conservation status or research.
In 2010, Lincoln Park Zoo, a free, 49-acre zoo in the heart of Chicago, launched a new approach to exhibit signs, in terms of both the process and the content. The goal was to create compelling interpretive graphics that took visitors beyond species identification and empowered them to connect to the zoo’s “living exhibits” on an intellectual and emotional level. Past exhibit graphics were mostly uniform in appearance and content, and were designed by communications staff with input from curatorial staff. Having been through various signs and designs over the years, there was skepticism among some staff that exhibit signage could alter how visitors behaved in the exhibit space – i.e. how much time they spent in the space, how long visitors observed the animals, etc. The new process was initiated soon after the redesign of our eastern black rhinoceros (rhino) habitat into the Harris Family Foundation Black Rhinoceros Exhibit. As a result of strategic planning and organizational restructuring, new interpretive plans had been set in place that involved a greater level of institutional commitment and resources. Prior to the change in process and design, graphics in this space presented basic information about rhinos (i.e. scientific name, habitat, natural history, and distribution), but did not provide zoo visitors with an opportunity to experience the story of the black rhino and its uncertain future. The signs provided no tactile or hands-on interpretive components and offered no compelling conservation story (Figure 1).
The rhino exhibit itself consists of three separate habitats spanning half an acre total. Habitats two and three are designed with a hydraulic gate separating them so that when opened the two habitats become one. The exhibit is located at the northern most end of the zoo, and is accessed via a path that borders the habitat fence. Additionally, one of the zoo’s six visitor entrances (and thus first impressions) is directly adjacent to the rhino exhibit. Visitors can approach the exhibit from the east or west, as well as from the south when exiting the Regenstein African Journey exhibit. The resident rhinos are housed separately to mimic their natural socialization patterns, with the exception of a mother-offspring pair, and are typically visible to visitors unless they choose to go indoors to their off-exhibit holding space. (Note, at the time of this study, Lincoln Park Zoo’s collection included three adult rhinos.)
The goal for redesigning both the process and the signage in this space was to provoke a change in visitor behavior, namely that visitors would engage more with the signs and the animals, and that their overall stay time at the exhibit would increase as a result. This would indicate not only that the updated signs were more effective than their predecessors (and thus could inform future exhibit sign decisions) but might also suggest that signs of this nature have the ability to connect visitors to animals in a new way.
A New Approach to Content
The first step in the signage project was the development of a cross-departmental team, consisting of the vice president of education, the director and manager of guest engagement (interpretation), the vice president of animal care, the general curator, the zoological manager responsible for rhino care, the director of the Davee Center for Epidemiology and Endocrinology (who studies rhinos both in situ and ex situ, or in the wild and in zoo settings), the senior director of design and communications, and a staff writer. Together, this team created several possible key messages for the space.
Six possible key messages emerged from early brainstorm meetings.
- Rhinos are tough (physically) but populations are fragile (their status and future).
- By visiting the zoo today, you can be a rhino ambassador. Share something you learned with a friend.
- Support your zoo. They can help rhinos today by supporting field research.
- Nonnative species can have a negative impact on wild populations when improperly introduced (in the case of rhinos it can mean competition for land and resources).
- Responsible consumers make a positive impact on wild animals like rhinos.
- Purchasing products that support sustainable/alternative forms of income in developing countries can reduce the demand for wildlife as a form of income.
These messages were shared with other zoo and aquarium professionals via the Association of Zoos and Aquariums (AZA) education listserv, where feedback and suggestions were encouraged. Individuals from nine organizations that exhibit rhinos replied, with overwhelming favorability towards message number one. Respondents also liked the ideas of supporting one’s local zoo and empowering guests to make change in their own lives that benefit rhinos.
The team also tested messages with an internal focus group of teen interns (high school sophomores through college freshmen) to determine if the messages resonated with them. Teen interns were part of a job training program where they were on zoo grounds during part of their internship. Therefore, their experience interacting with guests and being immersed in the zoo provided a unique testing audience. Eight teens worked in small groups to do some basic concept mapping about the questions they had about rhinos, as well as experiences they had with guests on zoo grounds prior to the draft message being shared. The teens expressed that the first questions asked by guests related specifically to the zoo’s rhinos and the care provided to them. According to the teens, guests expressed wanting to know how much the animals weighed and whether they were dangerous.
The possible key messages and the teen concept maps were compared to see what gaps existed. The message “rhinos are tough but populations are fragile” most resonated with the teens as demonstrating the fate of rhinos to be uncertain. The teens also suggested that they were unclear how members of the general public could help these animals. This revelation suggested the value of building an interactive to let zoo visitors know they could be a meaningful part of the solution.
As a final part of the prototyping and message testing, the team constructed a temporary rhino silhouette made of foam core and placed it near the exhibit to gauge visitor interest. Visitors flocked to the prototype and asked questions about the size and care of the rhinos. These questions helped further refine the content that was utilized in the final version. We also used the foam prototype as a way to test whether it was a recognizable silhouette; would people know that it was a rhino and thus draw their attention to the exhibit? This could be significant, since previously many people walked by the habitat without ever stopping to notice the animals in the space.
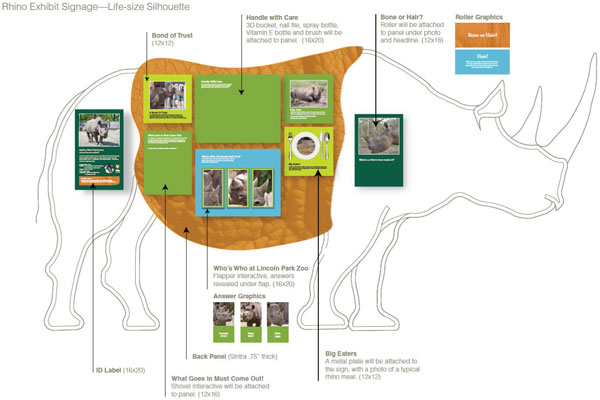
Figure 2: Schematic of new rhino signage, which highlights animal care techniques and tools.
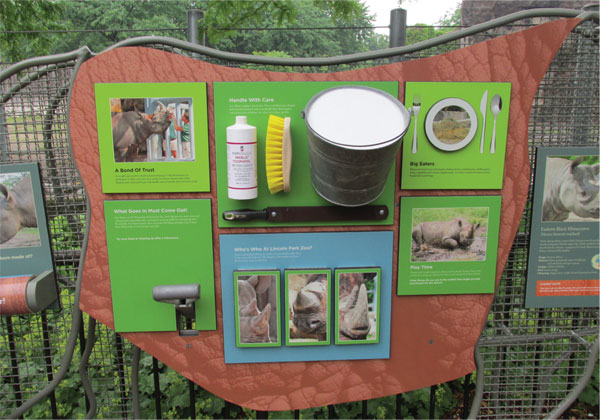
Figure 3: Close-up of animal care messaging at the new rhino sign. Clockwise from top center: a bucket full of lotion, a nail file, a scrub brush, and vitamins are essential tools of the trade; a dinner plate graphic describes rhinoceros diets; rhinos enjoy mud and other features of their habitats; rhino horn shapes and sizes help keepers and researchers identify individual rhinos; a shovel handle simulates the weight of a rhino’s entire day of fecal waste; keepers and rhinos work together in daily training sessions to maintain the health and well-being of the animals. Photo courtesy of Rich Faron.
After all this brainstorming and testing, the team landed on the content and physical look for the new signage. A life-size rhino silhouette was constructed that focused on the unique aspects of caring for rhinoceroses in a zoological setting. This also enabled the zoo to demonstrate its commitment to world-class care overall. Interactive components built into the design highlighted common questions, such as diet and nutrition (What do rhinos eat?), behavioral enrichment (What do rhinos like to do?), and health care (How do you trim a rhino’s toenails?) (Figures 2 and 3).
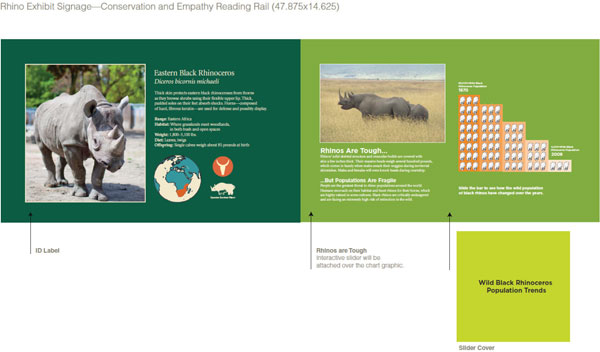
Figure 4: The first reading rail details rhino natural history and conservation status.
The team also felt confident incorporating conservation messaging into the signage, since that resonated both with other zoo professionals as well as the teen focus group. Indeed, research also supports the idea that zoo visitors want to better understand conservation challenges affecting threatened species and what their local zoo is doing to help (Fraser, Bicknell, Sickler, & Taylor, 2009). Thus, in addition to the rhino silhouette, two complementary reading rails were designed and installed. The first reading rail shares the story of wildlife conservation with the message “Rhinos are tough, but populations are fragile.” It highlights challenges and successes for wild rhino populations, focusing on personal relevancy and creating a sense of empathy (Figure 4).
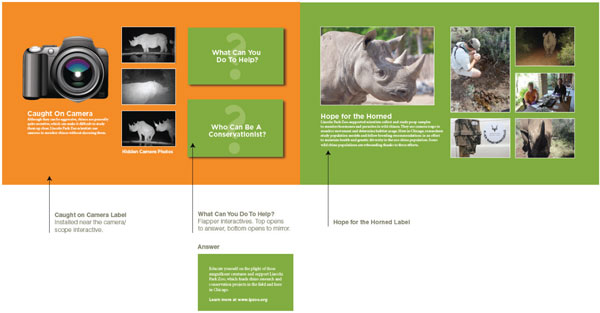
Figure 5: The second reading rail describes the work of Lincoln Park Zoo scientists in support of rhino conservation efforts.
The second reading rail presents the story of conservation science at Lincoln Park Zoo, specifically highlighting the zoo’s research interests in endocrinology and its contributions to understanding rhinos in the wild and in zoological settings. This graphic introduces zoo visitors to Lincoln Park Zoo endocrinologist Dr. Rachel Santymire and her unique work studying rhino hormone levels through fecal samples, which supports better animal care at the zoo and more successful conservation efforts. This graphic also invites zoo visitors to take personal action for rhino conservation (Figure 5).
Visitor Tracking
The team felt confident that the messages and methods deployed in the new signage would resonate with zoo visitors, but it remained to be seen whether the new signs would impact how guests behaved in the exhibit space. To evaluate the design, holding power, and engagement level of the old and new graphics, visitor tracking was conducted during two four-week periods: one in August 2010 with the old graphics, and another in July 2011 after the new graphics were installed. A total of 104 subjects (58 pre- and 46 post-installation) were observed; every third party entering a predetermined area of the exhibit was observed without their knowledge and data was collected via handheld devices. The subject’s gender, approximate age, and group make-up (visiting alone, with adults, or with children) was noted, and evaluators timed four different variables of their behavior (Ross & Gillespie, 2009):
- Visit duration (how long visitors stayed in the rhino exhibit area)
- Graphics look duration (how long visitors looked at graphics)
- Exhibit look duration (how long visitors looked at rhinos or their habitat)
- Touch sign frequency (how many times visitors touched/physically interacted with signage)
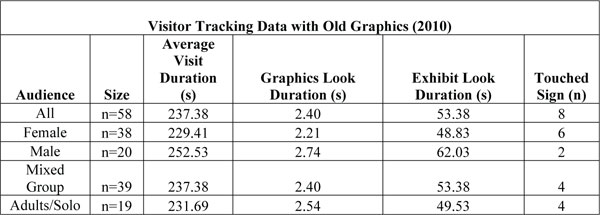
Table 1: Visitor Tracking Data with Old Graphics (2010)
Results
With the older graphics, the average stay time in the exhibit was roughly 237 seconds, or just under four minutes, with approximately one minute spent looking at the exhibit. Average time that study subjects spent looking at exhibit signs was just one percent of the total time spent in the designated area (Table 1), and fewer than 14 percent of the study subjects had physical contact with a graphic (i.e. touched).
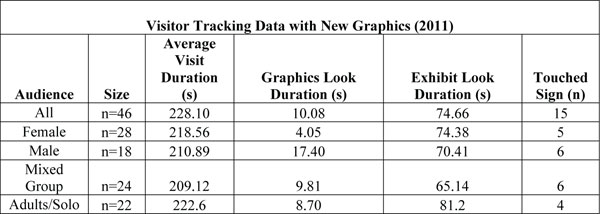
Table 2: Visitor Tracking Data with New Graphics (2011)
After the new graphics were installed, average exhibit stay time was 228 seconds, or three and a half minutes, thus slightly lower than the pre-installation figures (Table 2). Visitors’ average sign engagement time increased from 2.40 seconds (1% of their total exhibit stay time) to 10.08 seconds (4.4% of their total exhibit stay time), an increase of more than 400 percent. Time spent looking at the exhibit increased from 53.38 seconds to 74.66 seconds (a 40 percent increase), and the number of visitors who touched our rhino graphics nearly doubled, from 8 with the earlier graphics to 15 after new sign installation.
Breaking the data down into demographic groups reveals some interesting trends beyond the averages. Within gender, males were most affected by the interpretive graphic changes, exhibiting a 600 percent increase in time spent looking at exhibit graphics. Interestingly, females viewed the new graphics for dramatically less time than males, although visit and exhibit look durations were virtually equal to men. This may be due to social roles women played in these spaces, as they were anecdotally observed interacting with peers or accompanying children more than males did. It may also represent a difference in how men and women prefer to use exhibit spaces and graphics. However, evaluators did not take note of subjects’ activities outside of the scope of this study, so no solid conclusions can be drawn.
Informal Visitor Interviews
In addition to visitor follows, program staff also conducted 25 informal visitor interviews in February 2011. Interviews were short in duration and focused on what motivated guests to stop at the exhibit, as well as engagement levels with the signs. The aim of these interviews was to provide descriptive data regarding the guests’ subjective experience and the efficacy of the new rhino graphics, to complement the data from the visitor follows. Although the interviews took place outdoors in the cold Chicago winter climate, when rhinos are not allowed in the outdoor habitats, numerous members of the public nonetheless stopped to read and interact with the rhino signage, particularly the life-size silhouette. When asked, a majority of those guests who stopped indicated that they did so because of the hands-on elements of the signs. This suggests that signage, specifically interactive signage, might be attractive enough to guests to encourage them to spend time in a zoo exhibit, even when animals are not present. Additional studies are needed to properly assess this hypothesis, but it may be an important area of investigation for zoos that face different levels of animal visibility due to their climate or other factors.
Discussion
The study suggests that, at least at this site, well-designed signs do have the potential to change visitor behavior in an exhibit space, not just in relation to the signs themselves but also in relation to the animals on display. The opportunity for hands-on experiences is attractive to visitors, and, importantly, may cause them to stop at an exhibit even when animals aren’t present. However, dynamic signage may not impact all visitors equally. Multiple types of interpretation, including signs, demonstrations, videos, and chats, should be included to maximize a zoo’s potential impact on its visitors. Lincoln Park Zoo took this multimodal approach in 2016 with the design of its Walter Family Arctic Tundra, an exhibit showcasing polar bears. In that space, personal, digital, and static signage were all deployed, including a life-size interactive polar bear graphic, based on the indicated successes of the rhino signs. The zoo plans to evaluate the interpretation in that space in the near future to examine the interactive graphic relative to other interpretive elements. Follow-up studies examining conversations and interactions between visitors in both rhino and polar bear exhibits would provide further context to what, if any, social learning or emotional provocation is occurring as a result of this kind of signage.
Additionally, this study is an example of how institutions with limited budgets and resources can still make data-informed decisions. Evaluation of programs or interpretive elements need not be complex in order to provide important insights (Foster 2008). Yet practitioners in the informal learning and interpretive profession may often feel they lack the time, resources, or expertise to effectively evaluate their work (Kubarek and Trainer 2015). With even a simple methodology, however, practitioners can glean valuable insights that can help them be sure they are making wise investments in programs and collateral for the visitors that come through their doors.
Acknowledgments
Thank you to the Lester E. Fisher Center for the Study and Conservation of Apes, specifically Dr. Stephen Ross, for the use of data-tracking equipment to assist with data collection; Museum Explorer for help designing the interactive graphic elements; LPZ staff who helped with the project; and The Field Foundation of Illinois for its financial support of the project.
References
Arndt, M., Screven, C., Benusa, D., & Bishop, T. (1993). Behavior and learning in a zoo environment under different signage conditions. Visitor Studies: Theory, research, and Practice, 5, 245–251.
Falk, J.H., & L.D. Dierking. (2013). The Museum Experience Revisited. Walnut Creek, CA: Left Coast Press.
Fogelberg, K. (2014). Unsilencing voices: a study of zoo signs and their language of authority. Cultural Studies of Science Education, 9:787–799.
Foster, H. (2008). Evaluation Toolkit for Museum Practitioners. Norwich, UK: East of England Muesum Hub. Available for download at: http://sharemuseumseast.org.uk/shares/resource_34.pdf
Fraser, J., Bicknell, J., Sickler, J., Taylor, A. (2009). What information do zoo and aquarium visitors want on animal identification labels? Journal of Interpretation Research, 14(3), 7–20.
Kubarek, J. and L. Trainer. (2015). Empowering Museum Educators to Evaluate. Journal of Museum Education, 40:1, 3–7.
Leftridge, Alan. (2006). Interpretive Writing. Fort Collins, CO: The National Association for Interpretation.
Lindemann-Matthies, P., & T. Kamer. (2006). The influence of an interactive educational approach on visitors’ learning in a Swiss zoo. Science Education, 90:2, 296–315.
Packer, J., & R. Ballantyne. (2010). The role of zoos and aquariums in education for a sustainable future. New Directions for Adult and Continuing Education, 127, 25–34.
Ross, S., & K. Gillespie. (2009). Influences on visitor behavior at a modern immersive zoo exhibit. Zoo Biology, 28(5), 462–472.
Screven, C. (1992). Motivating visitors to read labels. ILVS Review: A Journal of Visitor Behavior, 2(2), 183–211.
Serrell, Beverly. (1996). Exhibit Labels: An Interpretive Approach. Walnut Creek, CA: AltaMira Press.